> ## Documentation Index
> Fetch the complete documentation index at: https://docs.xano.com/llms.txt
> Use this file to discover all available pages before exploring further.
# Request History
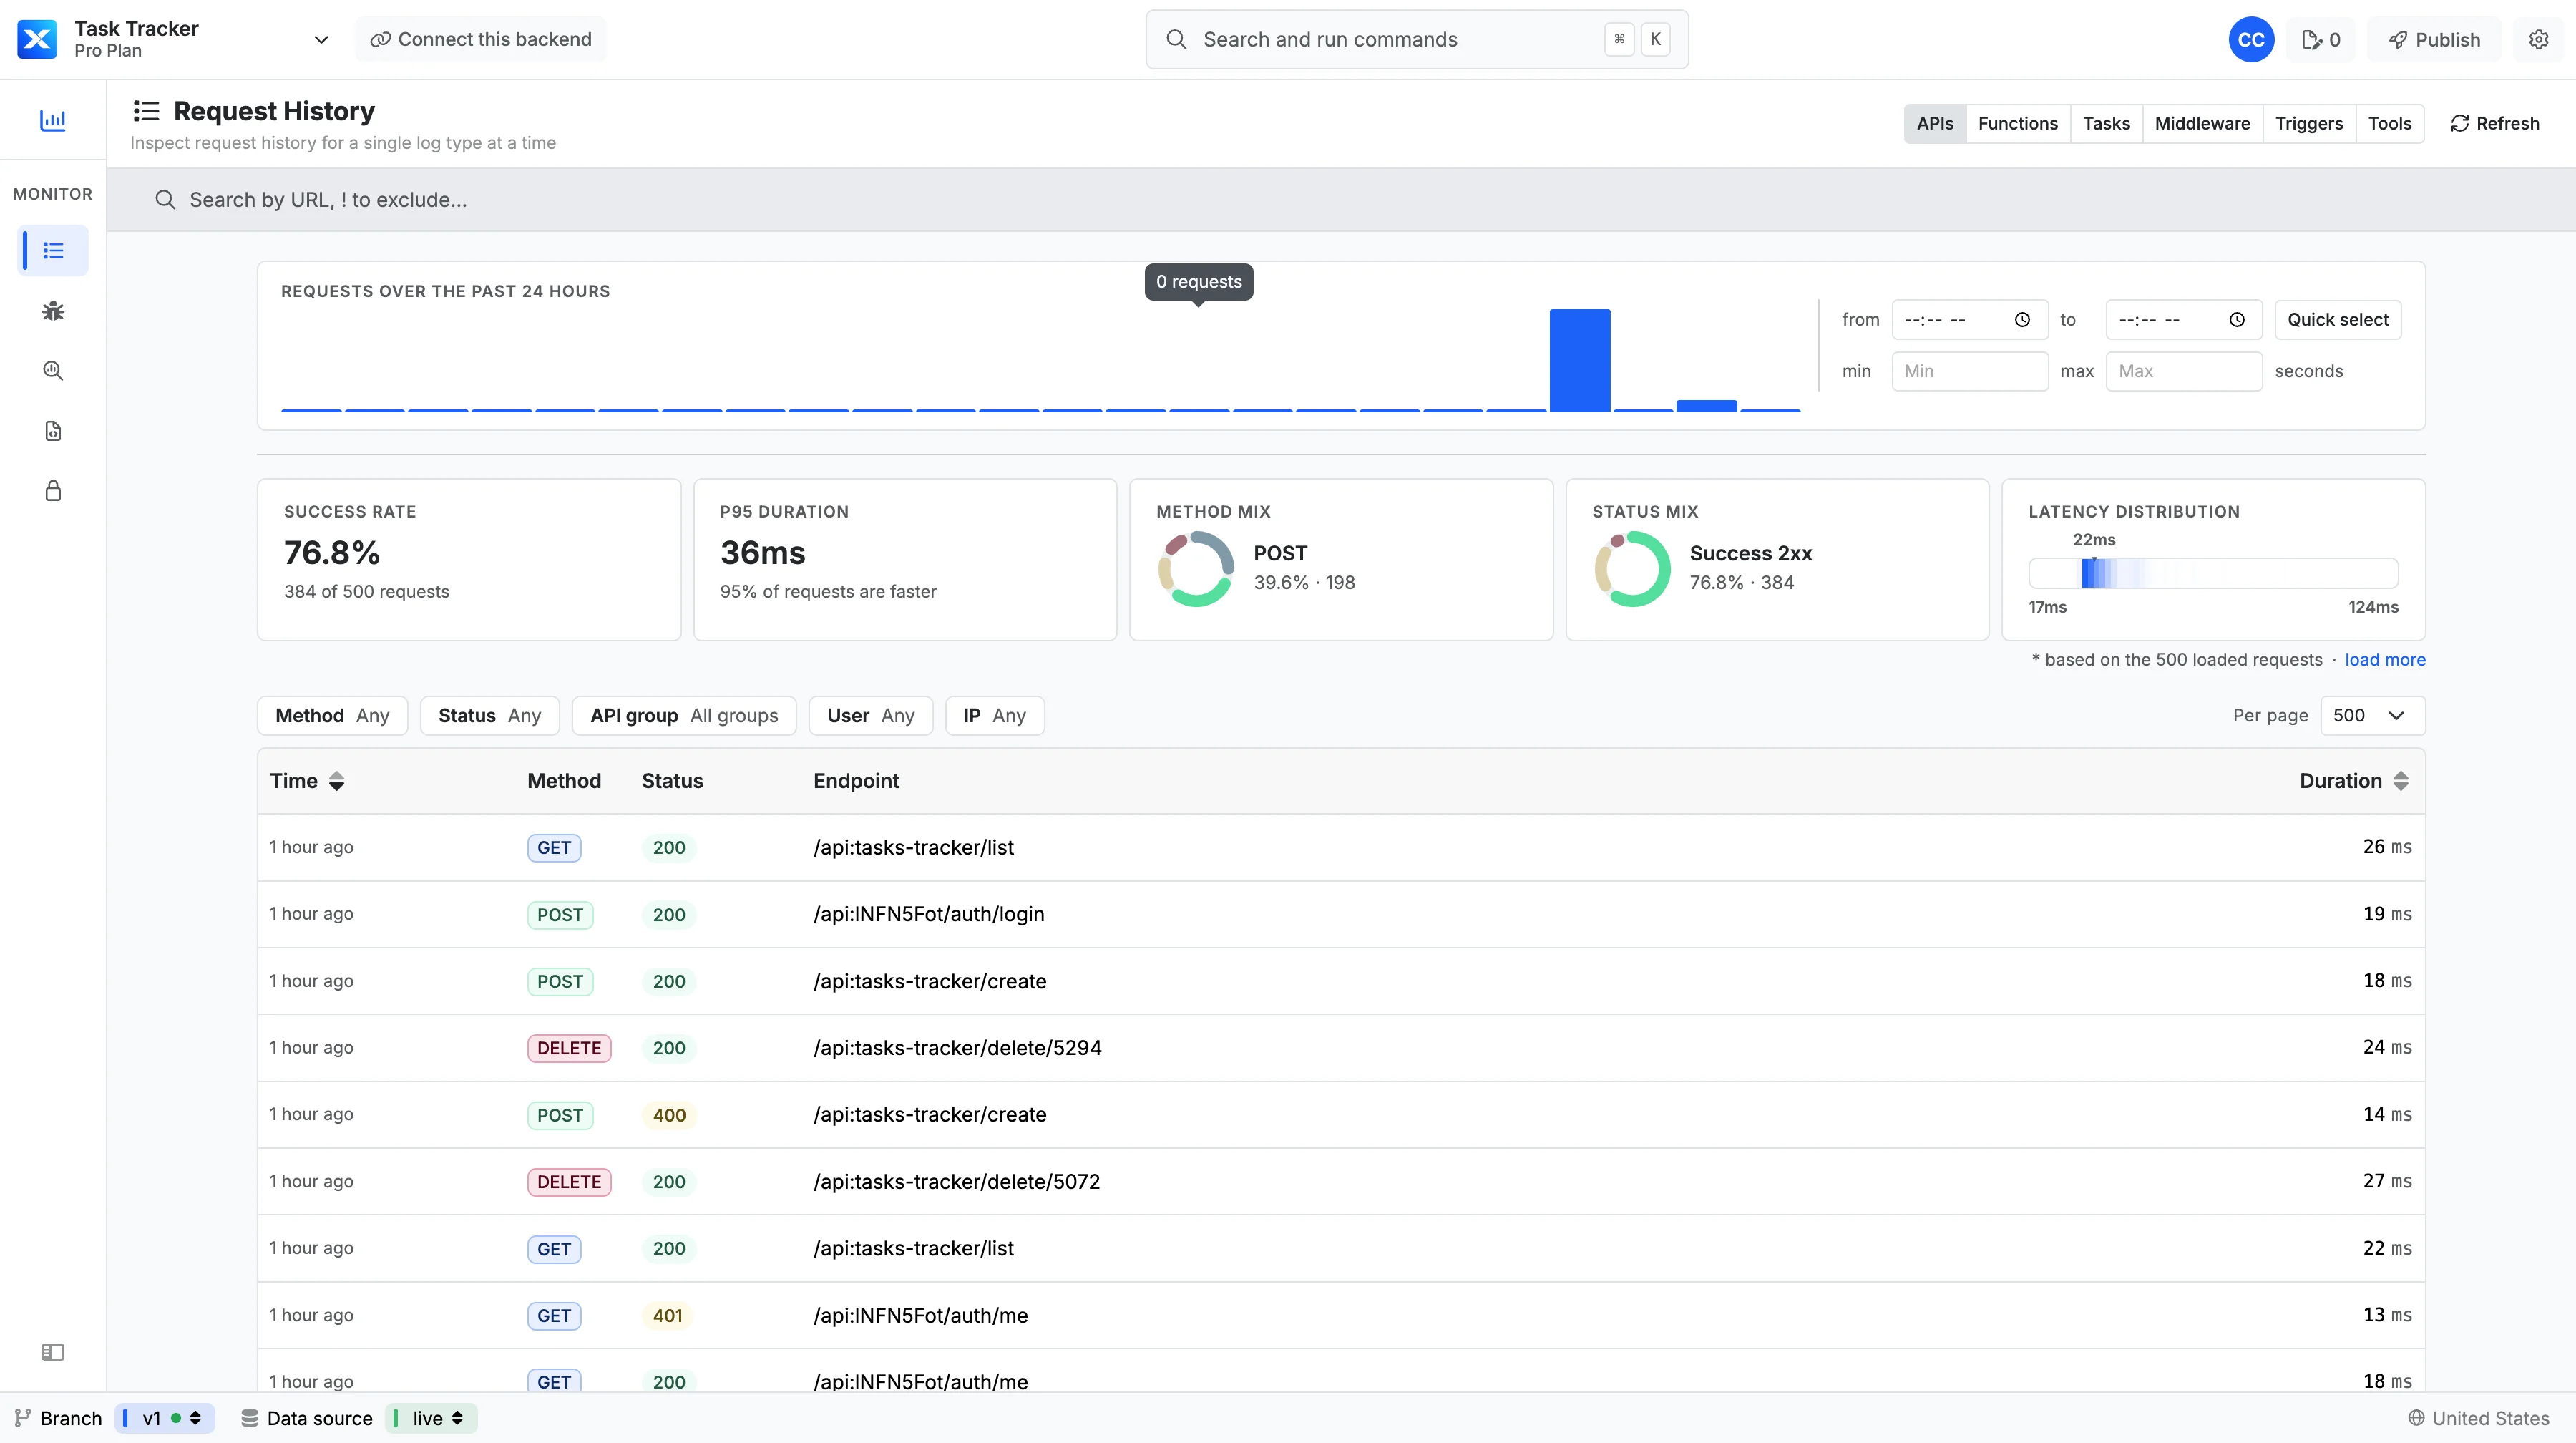
Request History records the requests that run through your workspace so you can inspect, debug, and monitor them after the fact. The revamped **Request History** dashboard brings every log type into a single workspace-level view with a 24‑hour activity graph, summary metrics, advanced filtering, and per‑request detail.
Request history is captured **per branch**. The dashboard shows the branch you currently have active — use **Switch branch** (or change your active branch) to view another branch's history.
## Ways to view request history
There are two ways to reach request history:
* **The Request History dashboard** — a workspace‑level page that brings every log type together with an activity graph, summary metrics, filters, and a searchable table. Most of this page covers the dashboard.
* **The slide‑out panel** — open request history for a single resource directly from its editor. See [Per‑object request history](#per-object-request-history).
This is a good opportunity to review your workspace settings by clicking the icon in the top-right corner. Specifically, take a look at:
* **Branch Defaults** - these determine what types of workflows are logged, and how much of each run is saved
* **Metrics Preferences** - both of these settings **must be enabled** to utilize all of the features of the request history dashboard, but are not required just to log requests
## The Dashboard
### Log types
| Tab | Records | Retention | Status/result | Free‑text search |
| -------------- | ------------------------------------------------------------------------------------------------------ | --------- | ---------------- | ----------------------- |
| **APIs** | Live API endpoint requests | 24 hours | HTTP status code | Search by URL/path |
| **Functions** | [Custom function](/the-function-stack/functions/custom-functions) runs that are part of a live request | 24 hours | Success / Error | Search by function name |
| **Tasks** | [Background task](/the-function-stack/building-with-visual-development/background-tasks) runs | 7 days | ok / exception | — |
| **Middleware** | Middleware runs | 24 hours | — | — |
| **Triggers** | Trigger runs (table, workspace, etc.) | 24 hours | — | Search by trigger name |
| **Tools** | AI/MCP tool runs | 24 hours | HTTP status code | Search by tool name |
What gets recorded differs by type:
* **Tasks** don't return a response, so no output/response is stored — but you still get the status, statement log, and timing.
* **Triggers** record their inputs (new/old record, action, data source) and timing; there is no output.
* **Middleware** records timing and the object it **wraps** (the API or task it ran for).
## The Dashboard
The dashboard inspects **one log type at a time**, selected from the tabs at the top of the page. You can also use the search, which supports a leading `!` to **exclude** matches — e.g. `!/api:auth/` hides requests whose path contains `/api:auth/`.
 ### Activity over the past 24 hours
The histogram at the top of the page shows **request volume over the past 24 hours** in hourly buckets.
* **Drag** across the histogram to select a time window; a small click clears the selection.
* Use the **from / to** time pickers, the **Quick select** presets, or the **previous / next** arrows to move the window.
* **Quick select** presets: *Any time, Past 5 minutes, Past 15 minutes, Past 1 hour, Past 4 hours, Past 24 hours*.
### Activity over the past 24 hours
The histogram at the top of the page shows **request volume over the past 24 hours** in hourly buckets.
* **Drag** across the histogram to select a time window; a small click clears the selection.
* Use the **from / to** time pickers, the **Quick select** presets, or the **previous / next** arrows to move the window.
* **Quick select** presets: *Any time, Past 5 minutes, Past 15 minutes, Past 1 hour, Past 4 hours, Past 24 hours*.
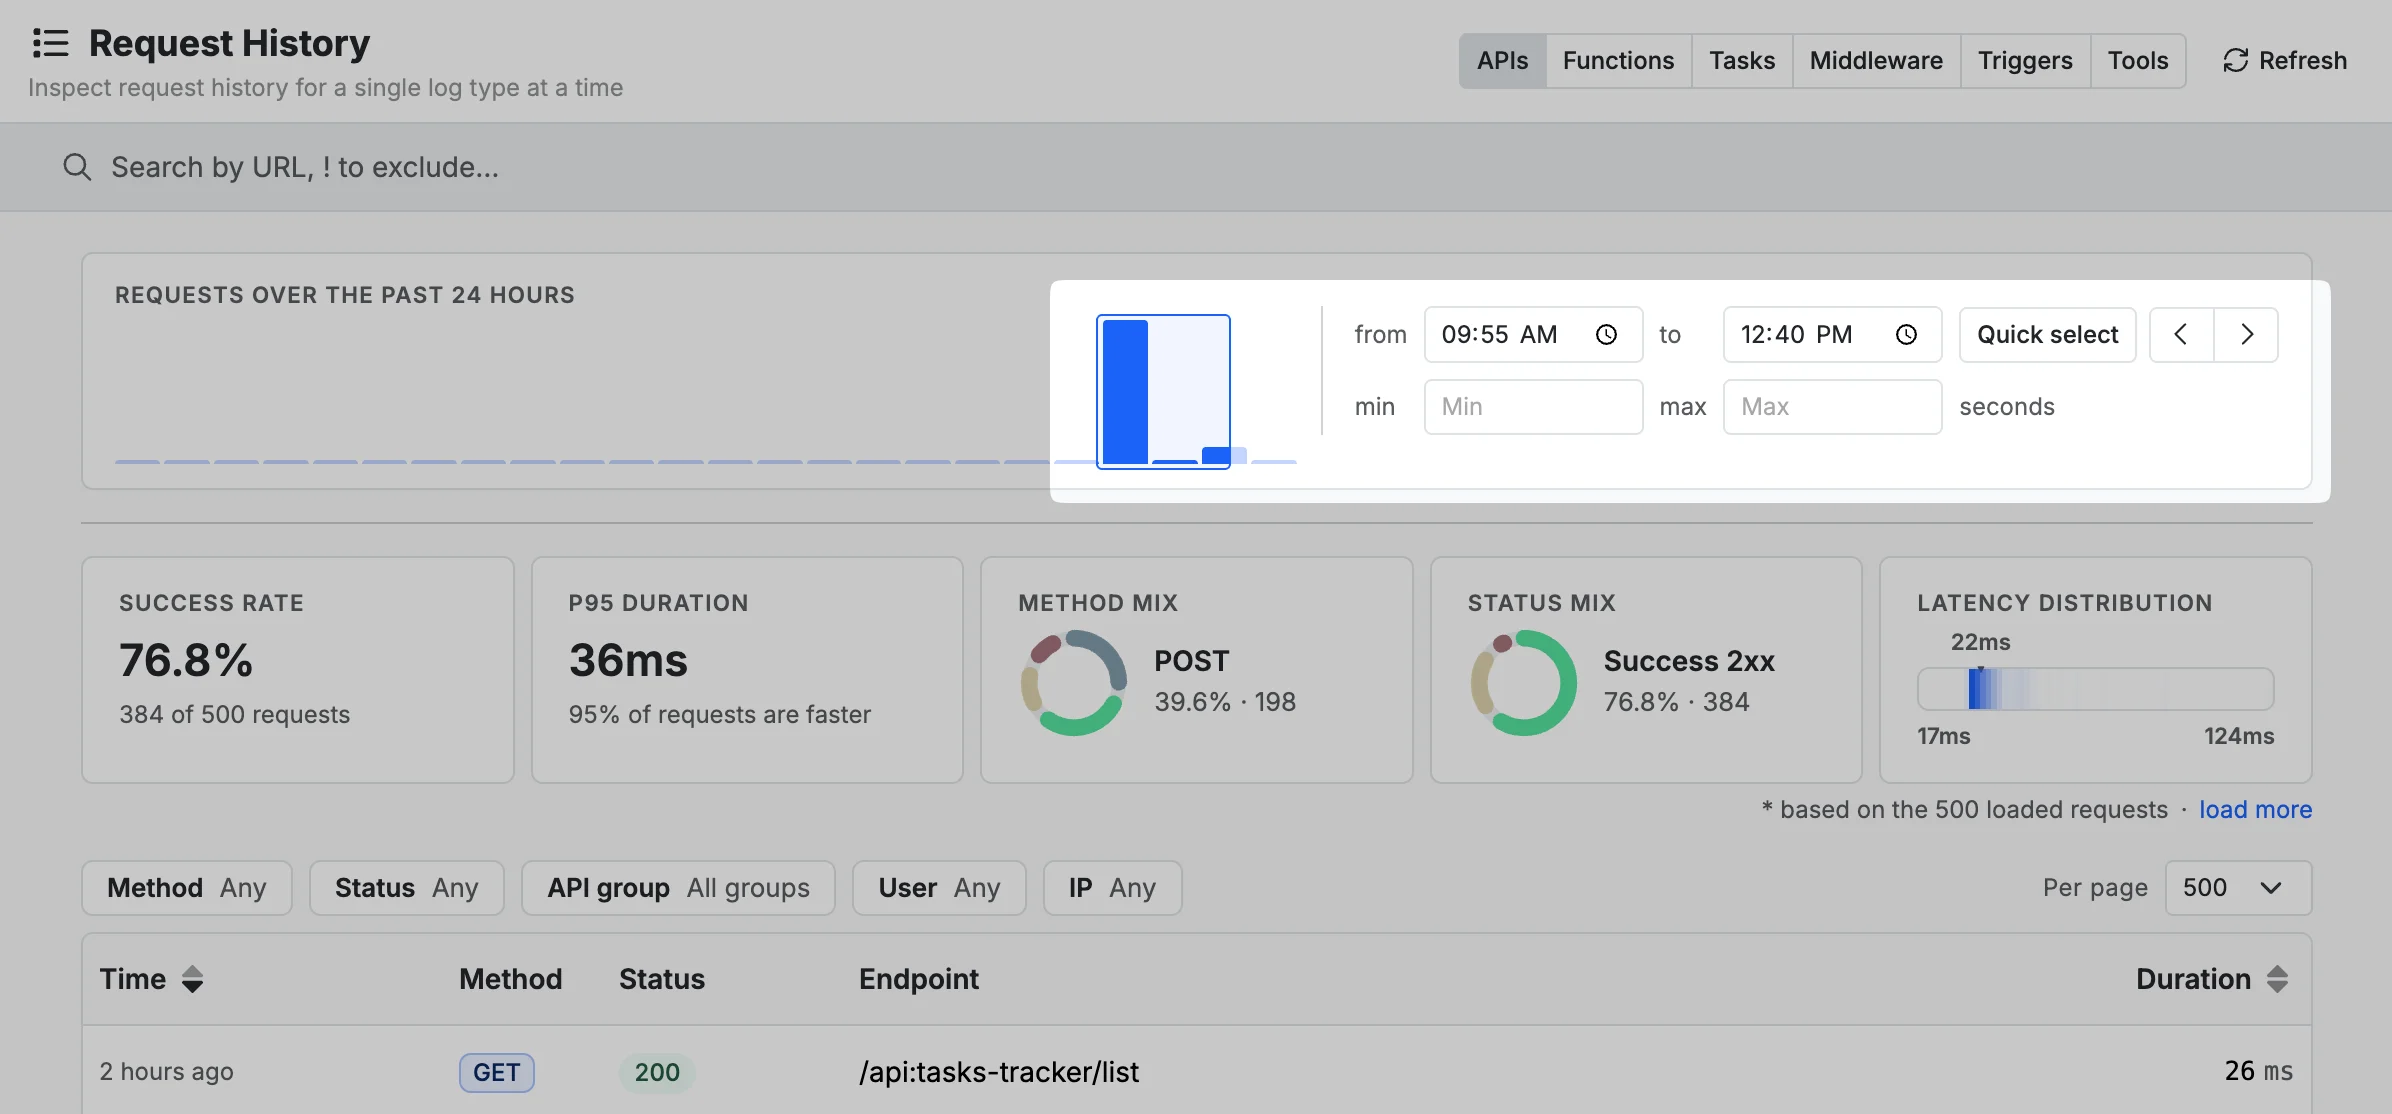 The histogram reflects the **Method** and **API group** filters (on the APIs tab) but not the other per‑request filters — those narrow the table only.
### Summary metrics
Below the histogram, a summary strip surfaces at‑a‑glance health for the current view:
* **Success rate** — percentage of successful requests, with an "X of Y requests" hint.
* **p95 duration** — 95th‑percentile response time ("95% of requests are faster").
* **Method mix** (APIs) — donut of GET / POST / PUT / PATCH / DELETE. Click a segment to filter by that method.
* **Status mix** (APIs & Tools) — donut of *Success 2xx / Redirect 3xx / User error 4xx / Server error 5xx*. Click to filter.
* **Result mix** (Functions & Tasks) — donut of *Success / Error* (Functions) or *ok / exception* (Tasks).
* **Latency distribution** — heatmap of request durations with a median (p50) marker.
The histogram reflects the **Method** and **API group** filters (on the APIs tab) but not the other per‑request filters — those narrow the table only.
### Summary metrics
Below the histogram, a summary strip surfaces at‑a‑glance health for the current view:
* **Success rate** — percentage of successful requests, with an "X of Y requests" hint.
* **p95 duration** — 95th‑percentile response time ("95% of requests are faster").
* **Method mix** (APIs) — donut of GET / POST / PUT / PATCH / DELETE. Click a segment to filter by that method.
* **Status mix** (APIs & Tools) — donut of *Success 2xx / Redirect 3xx / User error 4xx / Server error 5xx*. Click to filter.
* **Result mix** (Functions & Tasks) — donut of *Success / Error* (Functions) or *ok / exception* (Tasks).
* **Latency distribution** — heatmap of request durations with a median (p50) marker.
 These summary metrics are calculated from the requests **currently loaded** in the table, not a server‑side aggregate of all history. Click **load more** below the cards to retrieve a larger sample.
### Filtering and search
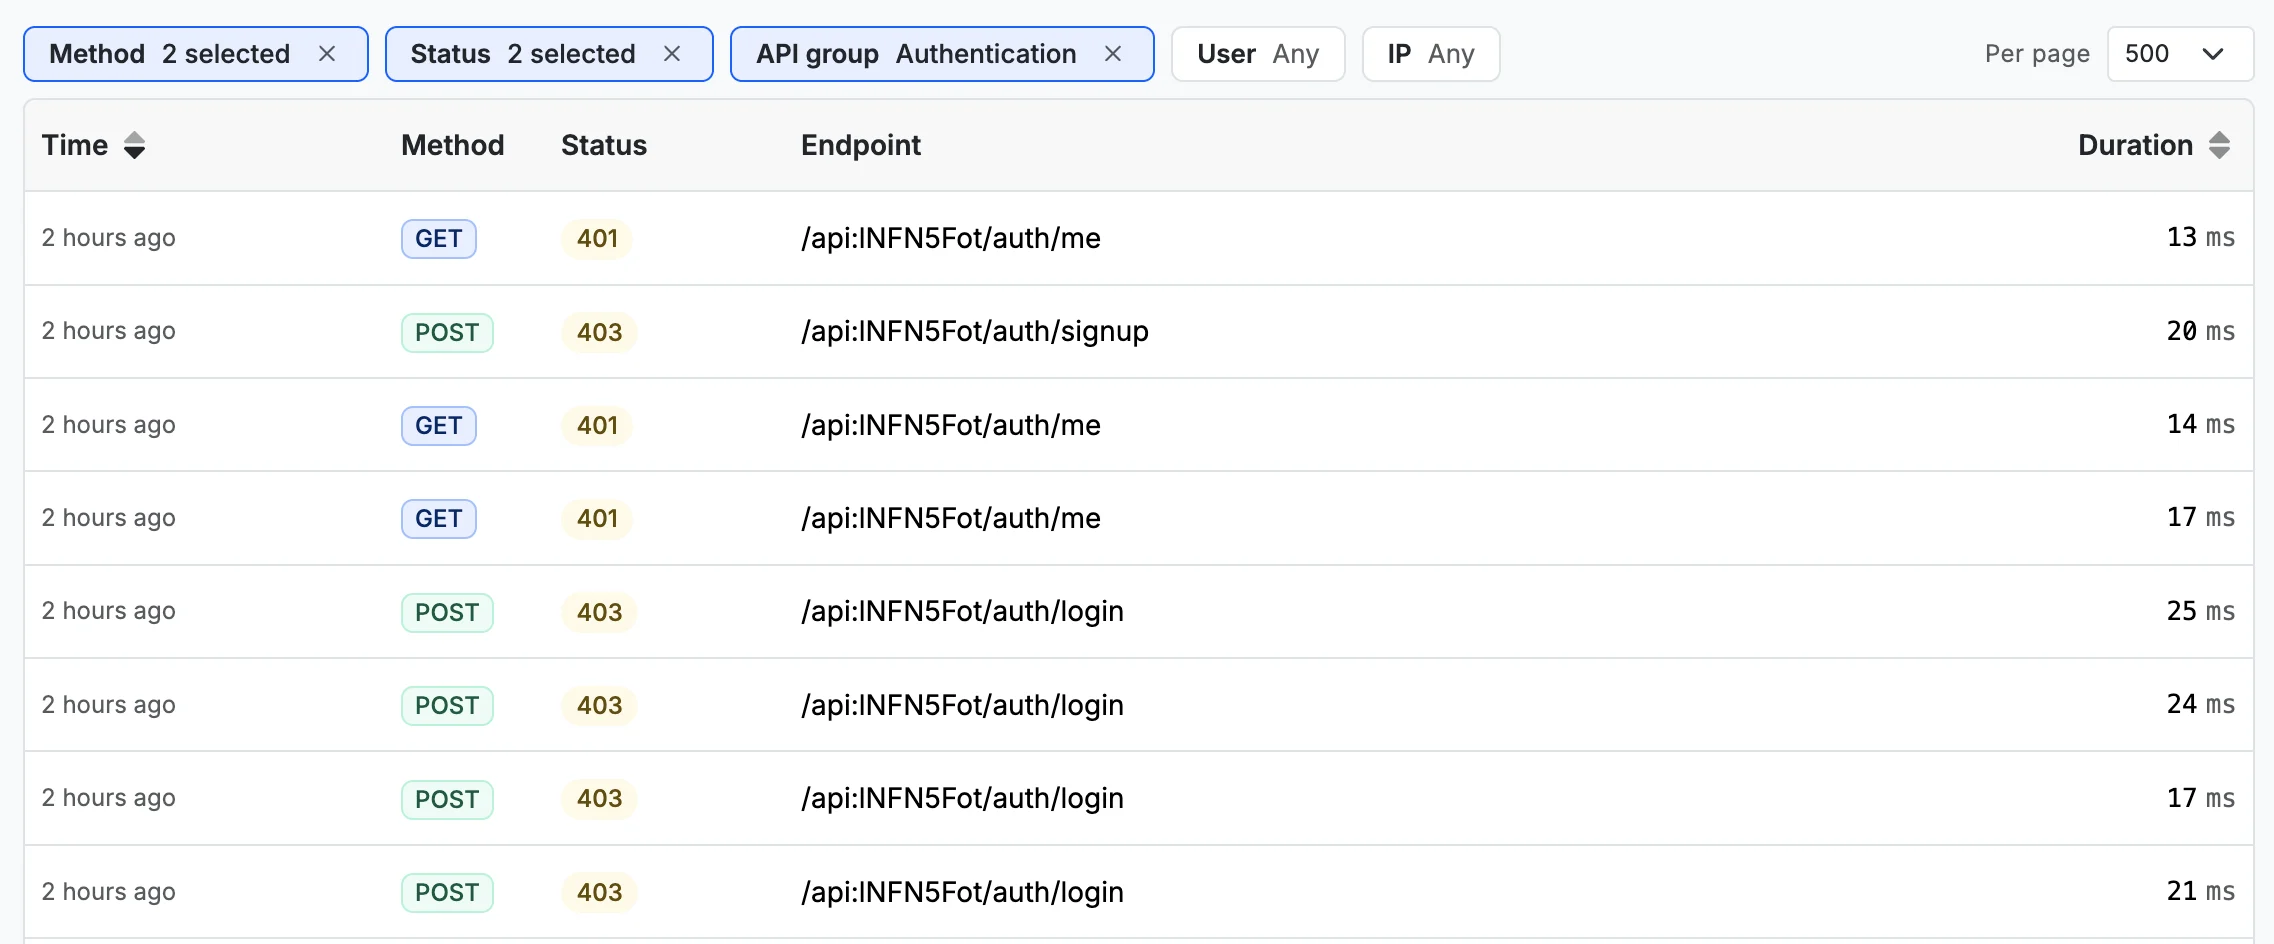
A compact filter bar sits above the table. Available filters depend on the active tab:
| Filter | Applies to | Notes |
| --------------- | -------------------------------- | ------------------------------------------------------------------------------ |
| **Search** | APIs, Functions, Triggers, Tools | Matches URL / name; prefix with `!` to exclude |
| **Time** | All | From/to pickers, quick‑select presets, or histogram drag |
| **Duration** | All | Min / max, in seconds |
| **Method** | APIs | GET, POST, PUT, PATCH, DELETE (multi‑select) |
| **Status** | APIs, Tools | Success 2xx, Redirect 3xx, User error 4xx, Server error 5xx |
| **Result** | Functions, Tasks | Success/Error (Functions); ok/exception (Tasks) |
| **API group** | APIs, Middleware | Multi‑select from your API groups |
| **User** | APIs, Functions, Tools | Filter by authenticated user (or *Unauthenticated*); typeahead by name/email |
| **IP** | APIs, Middleware | Add one or more IP addresses |
| **Frequency** | Tasks | Runs at least / at most every 5 min, 15 min, 30 min, 1 hour, 2 hours, 24 hours |
| **Action** | Triggers | Insert, Update, Delete, Truncate |
| **Table** | Triggers | Filter by the table the trigger fires on |
| **Data source** | Triggers | Filter by data source (when more than one exists) |
| **Per page** | All | 25, 50, 100, 500, 1000 (default 500) |
These summary metrics are calculated from the requests **currently loaded** in the table, not a server‑side aggregate of all history. Click **load more** below the cards to retrieve a larger sample.
### Filtering and search
A compact filter bar sits above the table. Available filters depend on the active tab:
| Filter | Applies to | Notes |
| --------------- | -------------------------------- | ------------------------------------------------------------------------------ |
| **Search** | APIs, Functions, Triggers, Tools | Matches URL / name; prefix with `!` to exclude |
| **Time** | All | From/to pickers, quick‑select presets, or histogram drag |
| **Duration** | All | Min / max, in seconds |
| **Method** | APIs | GET, POST, PUT, PATCH, DELETE (multi‑select) |
| **Status** | APIs, Tools | Success 2xx, Redirect 3xx, User error 4xx, Server error 5xx |
| **Result** | Functions, Tasks | Success/Error (Functions); ok/exception (Tasks) |
| **API group** | APIs, Middleware | Multi‑select from your API groups |
| **User** | APIs, Functions, Tools | Filter by authenticated user (or *Unauthenticated*); typeahead by name/email |
| **IP** | APIs, Middleware | Add one or more IP addresses |
| **Frequency** | Tasks | Runs at least / at most every 5 min, 15 min, 30 min, 1 hour, 2 hours, 24 hours |
| **Action** | Triggers | Insert, Update, Delete, Truncate |
| **Table** | Triggers | Filter by the table the trigger fires on |
| **Data source** | Triggers | Filter by data source (when more than one exists) |
| **Per page** | All | 25, 50, 100, 500, 1000 (default 500) |
 ### The request table
Each tab shows a table sorted by **Time** (newest first) by default. **Time** and **Duration** columns are sortable. Columns vary by type:
* **APIs** — Time · Method · Status · Endpoint · Duration
* **Functions** — Time · Function · Called from · Runtime (Sync / Async) · Duration
* **Tasks** — Time · Task · Status · PID · Duration
* **Middleware** — Time · Middleware · Wraps · Duration
* **Triggers** — Time · Trigger · Action · Duration
* **Tools** — Time · Tool · Toolset · Status · Duration
### The request table
Each tab shows a table sorted by **Time** (newest first) by default. **Time** and **Duration** columns are sortable. Columns vary by type:
* **APIs** — Time · Method · Status · Endpoint · Duration
* **Functions** — Time · Function · Called from · Runtime (Sync / Async) · Duration
* **Tasks** — Time · Task · Status · PID · Duration
* **Middleware** — Time · Middleware · Wraps · Duration
* **Triggers** — Time · Trigger · Action · Duration
* **Tools** — Time · Tool · Toolset · Status · Duration
 Use **Load more** at the bottom to fetch the next page of results; the page shows **End of results** when there are no more.
## Inspecting a request
Click any row to open the detail panel for that request.
Use **Load more** at the bottom to fetch the next page of results; the page shows **End of results** when there are no more.
## Inspecting a request
Click any row to open the detail panel for that request.
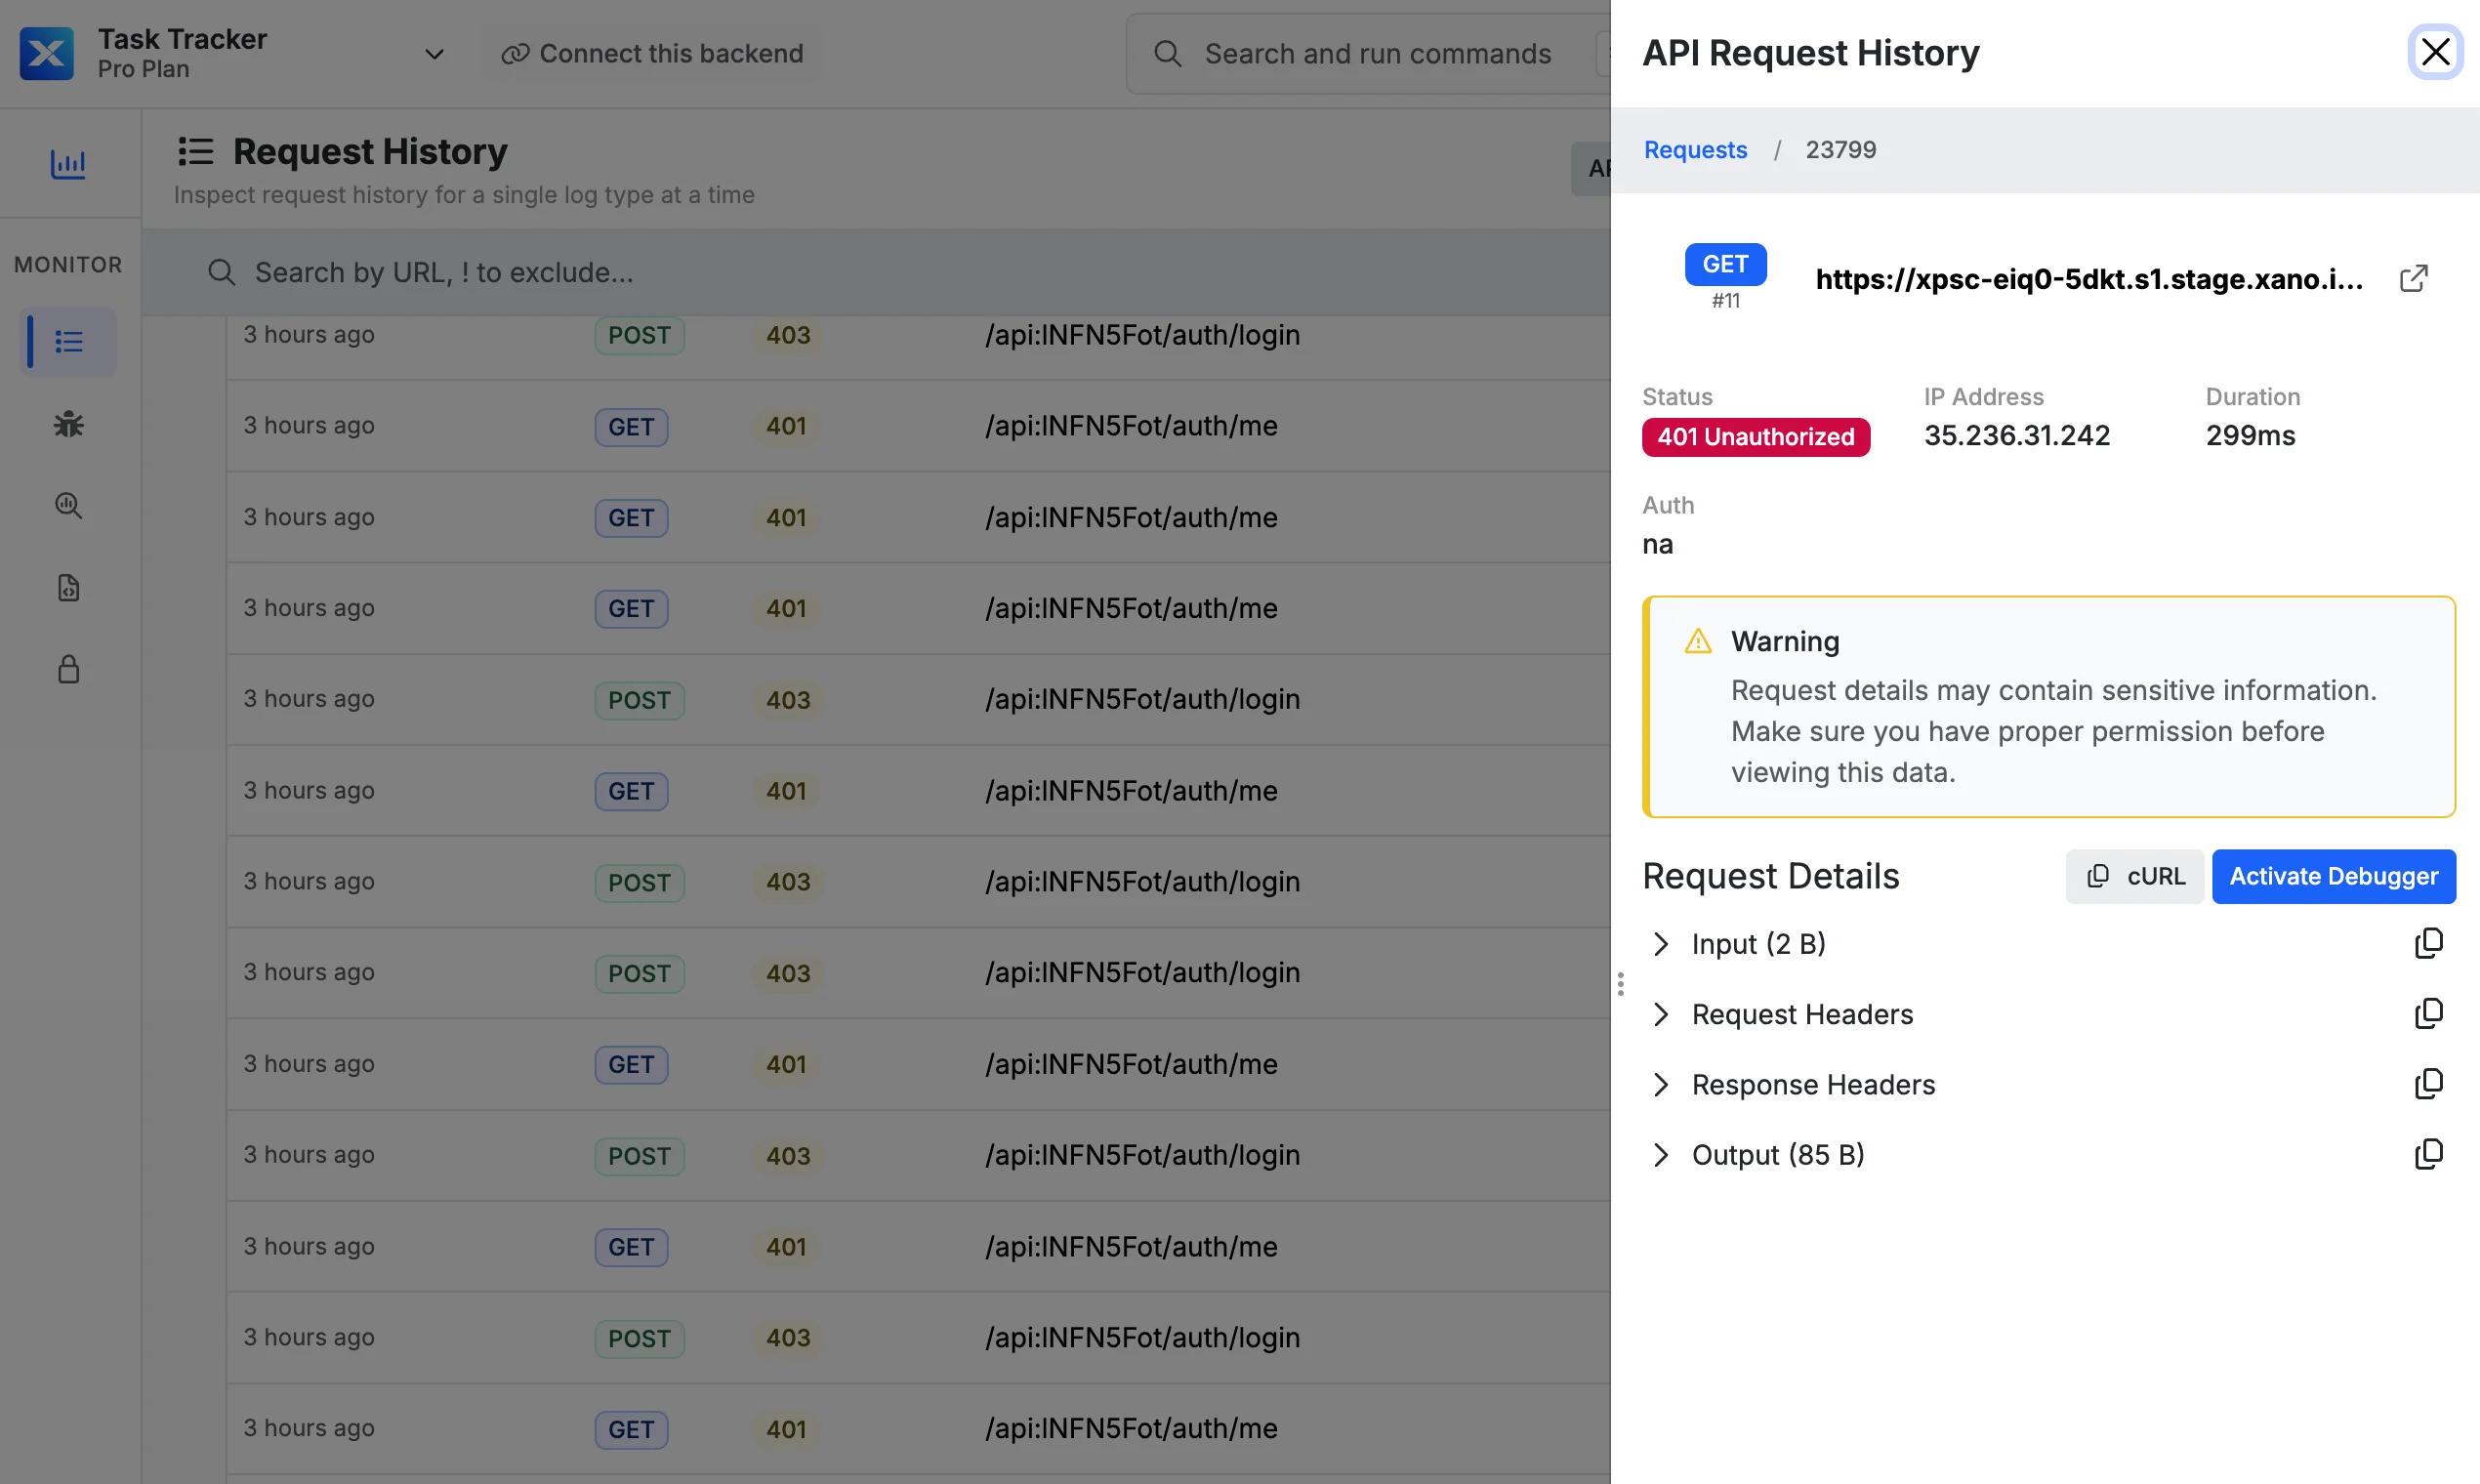 The panel includes:
* **Metadata** — time, user (if authenticated), IP, request/response size, status code, runtime mode, etc.
* **Input** — the request input/body (shows a note when the input exceeded the captured size limit).
* **Output / Response** — the response payload (omitted for Tasks and Triggers, which return no output).
* **Headers** — request/response headers, when captured.
* **Middleware stacks** — the PRE‑middleware, function stack, POST‑middleware, and post‑process steps. Stacks are limited by your branch's **statement limit** (see [Branch defaults](#branch-defaults)); a notice appears when the limit was reached or the stack wasn't recorded.
Action buttons in the panel:
* **Open in editor** — Click the route name at the top to jump to the editor
* **cURL** (APIs) — copy the request as a cURL command
* **Activate Debugger** — re‑run the request in the debugger (see below).
### Activate Debugger
From a request's detail panel, click **Activate Debugger** to re‑execute the request and open the [debugger](/testing-debugging/testing-and-debugging-function-stacks#using-the-debugger), where you can step through the entire execution one statement at a time. The request's original input is pre‑populated for you.
This is especially useful for investigating issues reported in production — you can replay the exact request that caused a problem and inspect each step of the function stack.
Activating the debugger **re‑executes the request against live data**. Depending on your logic, this could have side effects such as creating duplicate records, sending emails, processing payments, or modifying data. When you activate it on a **live branch** or a **production data source**, Xano warns you and asks you to confirm first. Use caution on requests that perform writes or trigger external services.
## Per‑object request history
You can also open the request history for a specific workflow directly from the editor.
The panel includes:
* **Metadata** — time, user (if authenticated), IP, request/response size, status code, runtime mode, etc.
* **Input** — the request input/body (shows a note when the input exceeded the captured size limit).
* **Output / Response** — the response payload (omitted for Tasks and Triggers, which return no output).
* **Headers** — request/response headers, when captured.
* **Middleware stacks** — the PRE‑middleware, function stack, POST‑middleware, and post‑process steps. Stacks are limited by your branch's **statement limit** (see [Branch defaults](#branch-defaults)); a notice appears when the limit was reached or the stack wasn't recorded.
Action buttons in the panel:
* **Open in editor** — Click the route name at the top to jump to the editor
* **cURL** (APIs) — copy the request as a cURL command
* **Activate Debugger** — re‑run the request in the debugger (see below).
### Activate Debugger
From a request's detail panel, click **Activate Debugger** to re‑execute the request and open the [debugger](/testing-debugging/testing-and-debugging-function-stacks#using-the-debugger), where you can step through the entire execution one statement at a time. The request's original input is pre‑populated for you.
This is especially useful for investigating issues reported in production — you can replay the exact request that caused a problem and inspect each step of the function stack.
Activating the debugger **re‑executes the request against live data**. Depending on your logic, this could have side effects such as creating duplicate records, sending emails, processing payments, or modifying data. When you activate it on a **live branch** or a **production data source**, Xano warns you and asks you to confirm first. Use caution on requests that perform writes or trigger external services.
## Per‑object request history
You can also open the request history for a specific workflow directly from the editor.
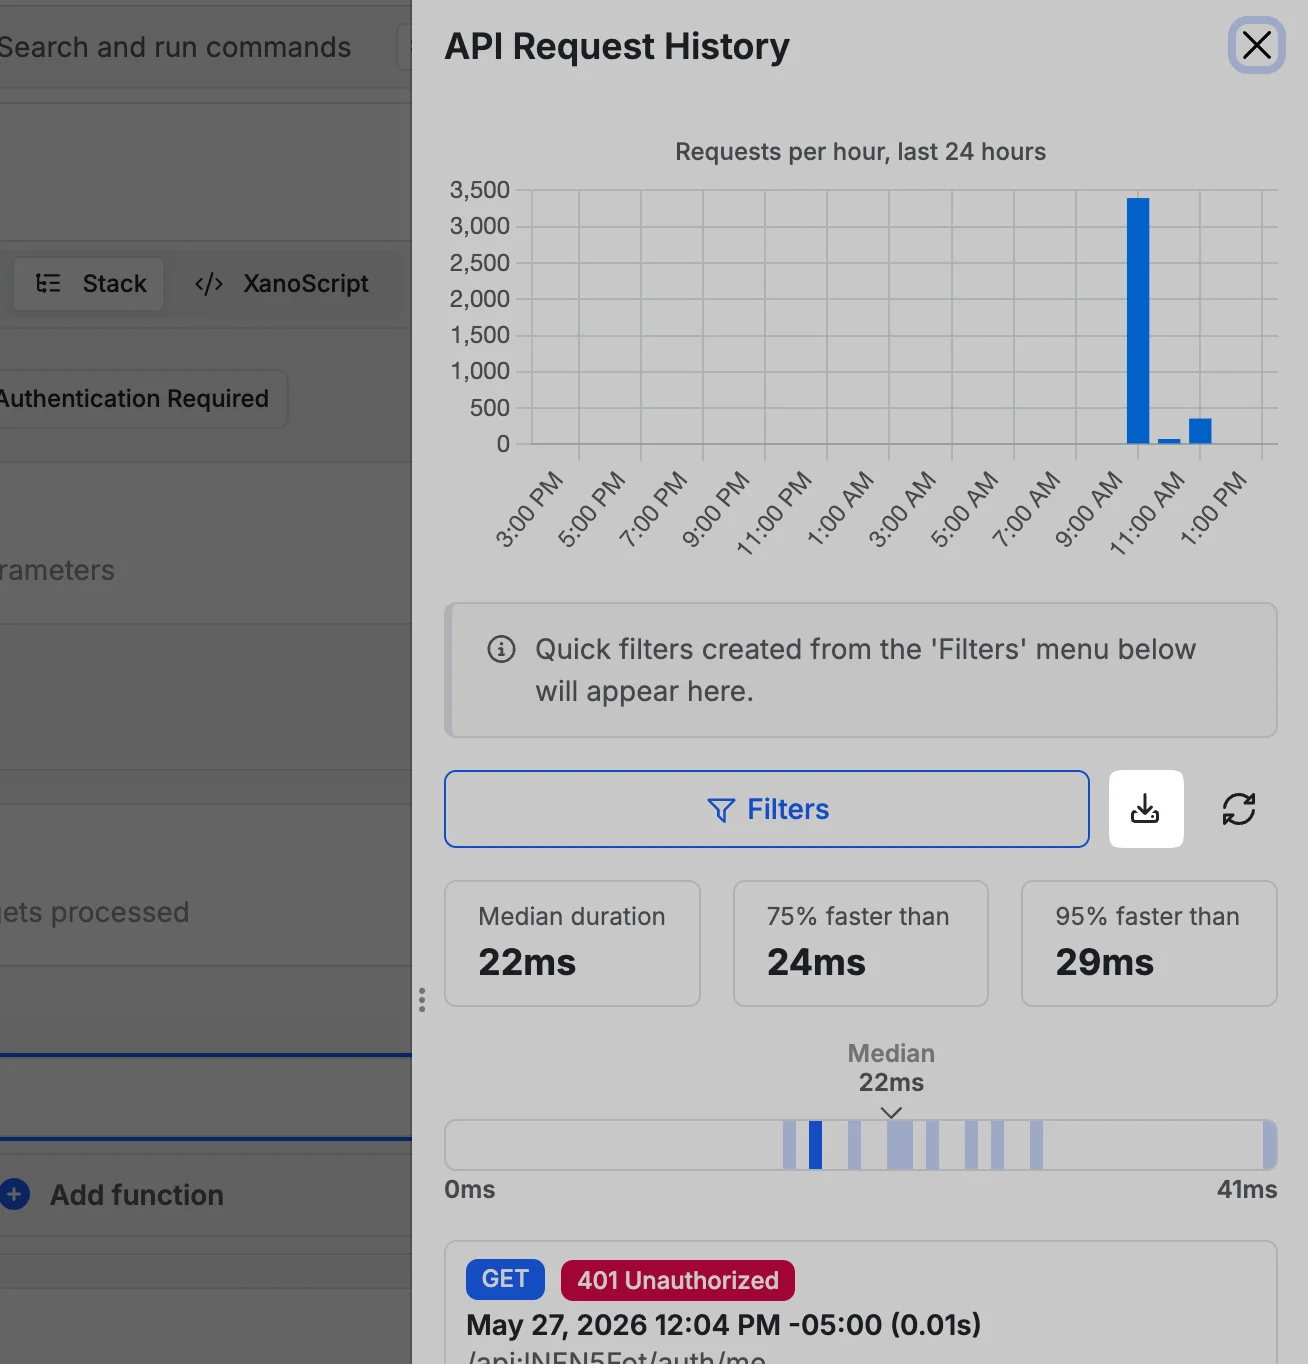
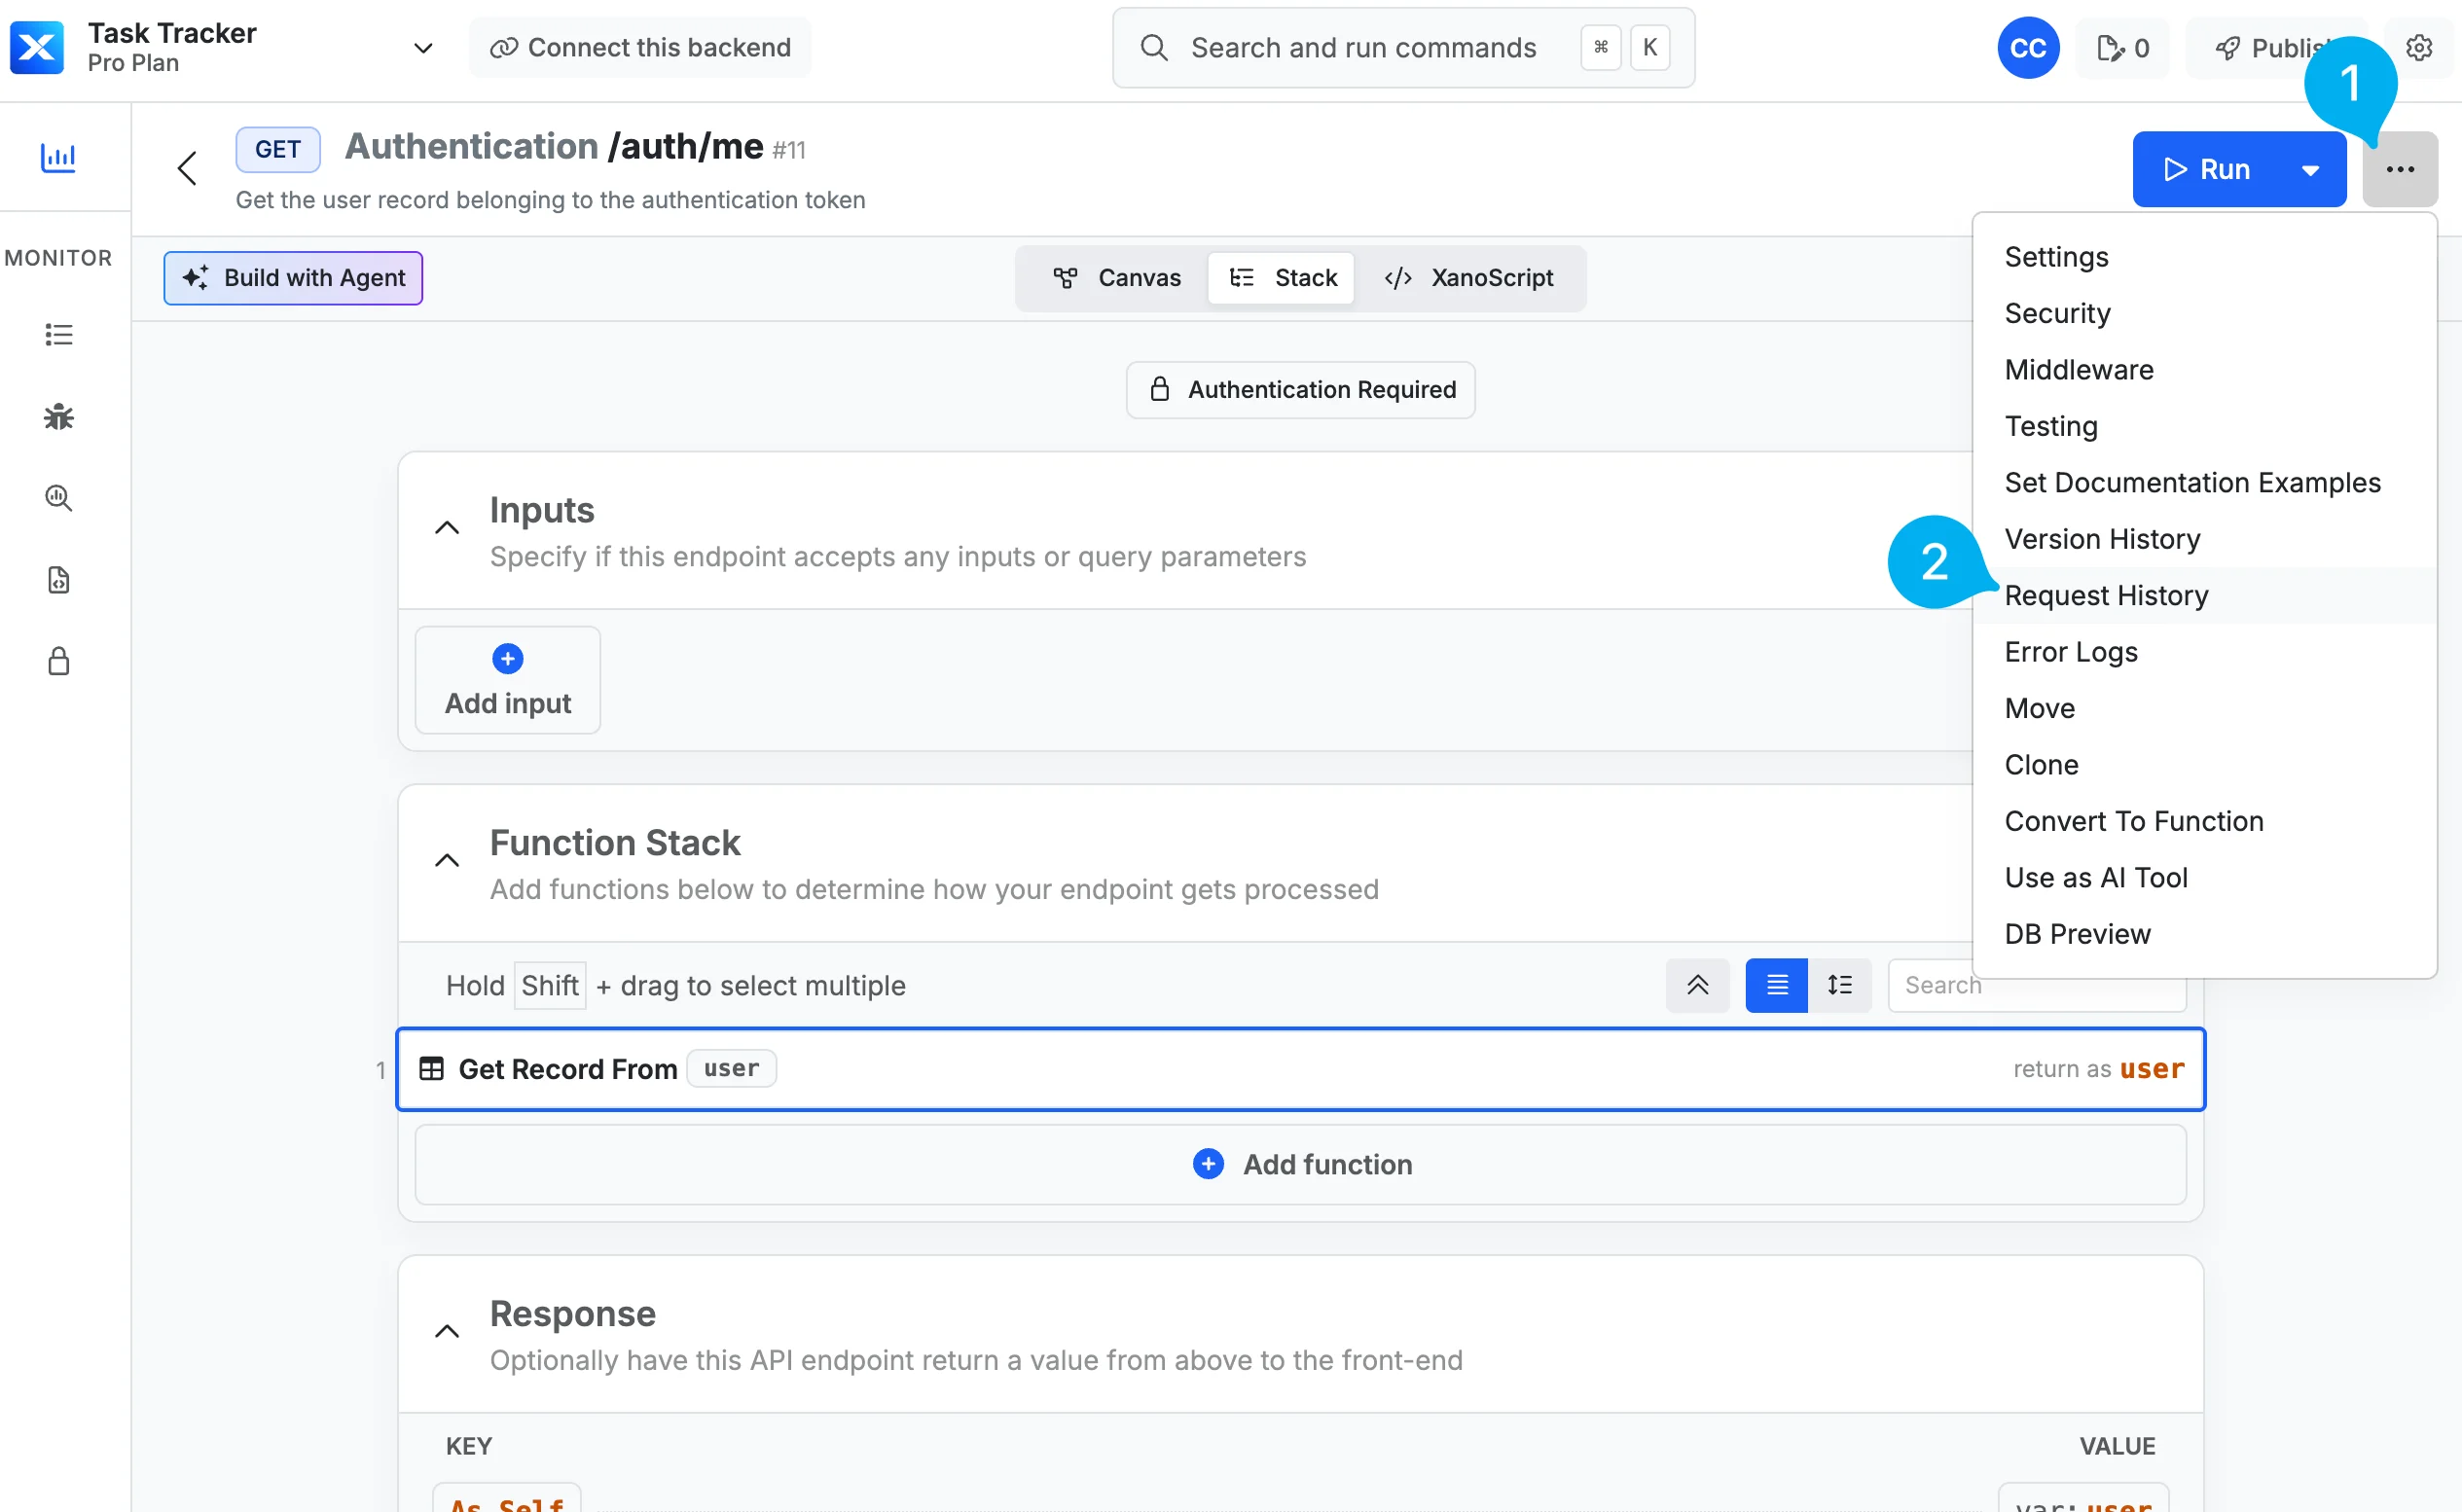 This opens the a panel scoped to that object, showing its recent requests. Selecting a request shows the same [detail view](#inspecting-a-request) as the dashboard — inputs, output, headers, debug logs, function/middleware stacks, **cURL**, and **Activate Debugger**.
The panel also shows per‑object **stats** for that resource:
* A runs chart — *"Runs per \[interval], last \[24 hours / 7 days] (max 1,000 runs)"*. Tasks can toggle between **Last 24 Hours** and **Last 7 Days**.
* **Median duration**, plus **75% faster than** and **95% faster than** markers, with a latency heatmap.
## Exporting request history
On the detail panel, click the button to download the request history for that workflow as a CSV.
This opens the a panel scoped to that object, showing its recent requests. Selecting a request shows the same [detail view](#inspecting-a-request) as the dashboard — inputs, output, headers, debug logs, function/middleware stacks, **cURL**, and **Activate Debugger**.
The panel also shows per‑object **stats** for that resource:
* A runs chart — *"Runs per \[interval], last \[24 hours / 7 days] (max 1,000 runs)"*. Tasks can toggle between **Last 24 Hours** and **Last 7 Days**.
* **Median duration**, plus **75% faster than** and **95% faster than** markers, with a latency heatmap.
## Exporting request history
On the detail panel, click the button to download the request history for that workflow as a CSV.
 Click the export (download) action to open **Export Request History**, then choose:
* **Export using current request history filters** — limit the export to what your active filters match (on by default).
* **Include request output** — include full response payloads. This can take significantly longer depending on response sizes (off by default).
Exports are processed **in the background**. When the export is ready you'll receive an **email notification**, and the file is available to download for **12 hours**.
Export is only available for API request history at this time. You can export other types of request history through the [Metadata API](#accessing-request-history-via-API)
## Per‑type notes
A few behaviors are specific to certain log types:
* **Functions** show **Called from** (the API or function that invoked them) and a **Runtime** badge (Sync, Async (shared), Async (dedicated)). Async functions may show "—" for *Called from*.
* **Tasks** retain history for **7 days** and let you toggle the runs chart between **Last 7 Days** and **Last 24 Hours**. The **Frequency** filter finds tasks that run at least / at most every N minutes. Tasks have no response output.
* **Triggers** record the **Action** (insert/update/delete/truncate), the affected **Table**, and **Data source**. Like tasks, triggers return no output.
* **Middleware** shows what each run **Wraps** (the API or task it ran for).
* **Tools** show their parent **Toolset** and an HTTP **Status**.
## Managing request history
### Branch defaults
> These are the default settings for what is logged in your Request History.
In your workspace settings, the **Branch Defaults** panel controls whether request history is recorded for each resource type and how many statements are kept per request. Disabling history stops logging requests of that type; the statement limit caps how many function‑stack entries are stored per request.
Click the export (download) action to open **Export Request History**, then choose:
* **Export using current request history filters** — limit the export to what your active filters match (on by default).
* **Include request output** — include full response payloads. This can take significantly longer depending on response sizes (off by default).
Exports are processed **in the background**. When the export is ready you'll receive an **email notification**, and the file is available to download for **12 hours**.
Export is only available for API request history at this time. You can export other types of request history through the [Metadata API](#accessing-request-history-via-API)
## Per‑type notes
A few behaviors are specific to certain log types:
* **Functions** show **Called from** (the API or function that invoked them) and a **Runtime** badge (Sync, Async (shared), Async (dedicated)). Async functions may show "—" for *Called from*.
* **Tasks** retain history for **7 days** and let you toggle the runs chart between **Last 7 Days** and **Last 24 Hours**. The **Frequency** filter finds tasks that run at least / at most every N minutes. Tasks have no response output.
* **Triggers** record the **Action** (insert/update/delete/truncate), the affected **Table**, and **Data source**. Like tasks, triggers return no output.
* **Middleware** shows what each run **Wraps** (the API or task it ran for).
* **Tools** show their parent **Toolset** and an HTTP **Status**.
## Managing request history
### Branch defaults
> These are the default settings for what is logged in your Request History.
In your workspace settings, the **Branch Defaults** panel controls whether request history is recorded for each resource type and how many statements are kept per request. Disabling history stops logging requests of that type; the statement limit caps how many function‑stack entries are stored per request.
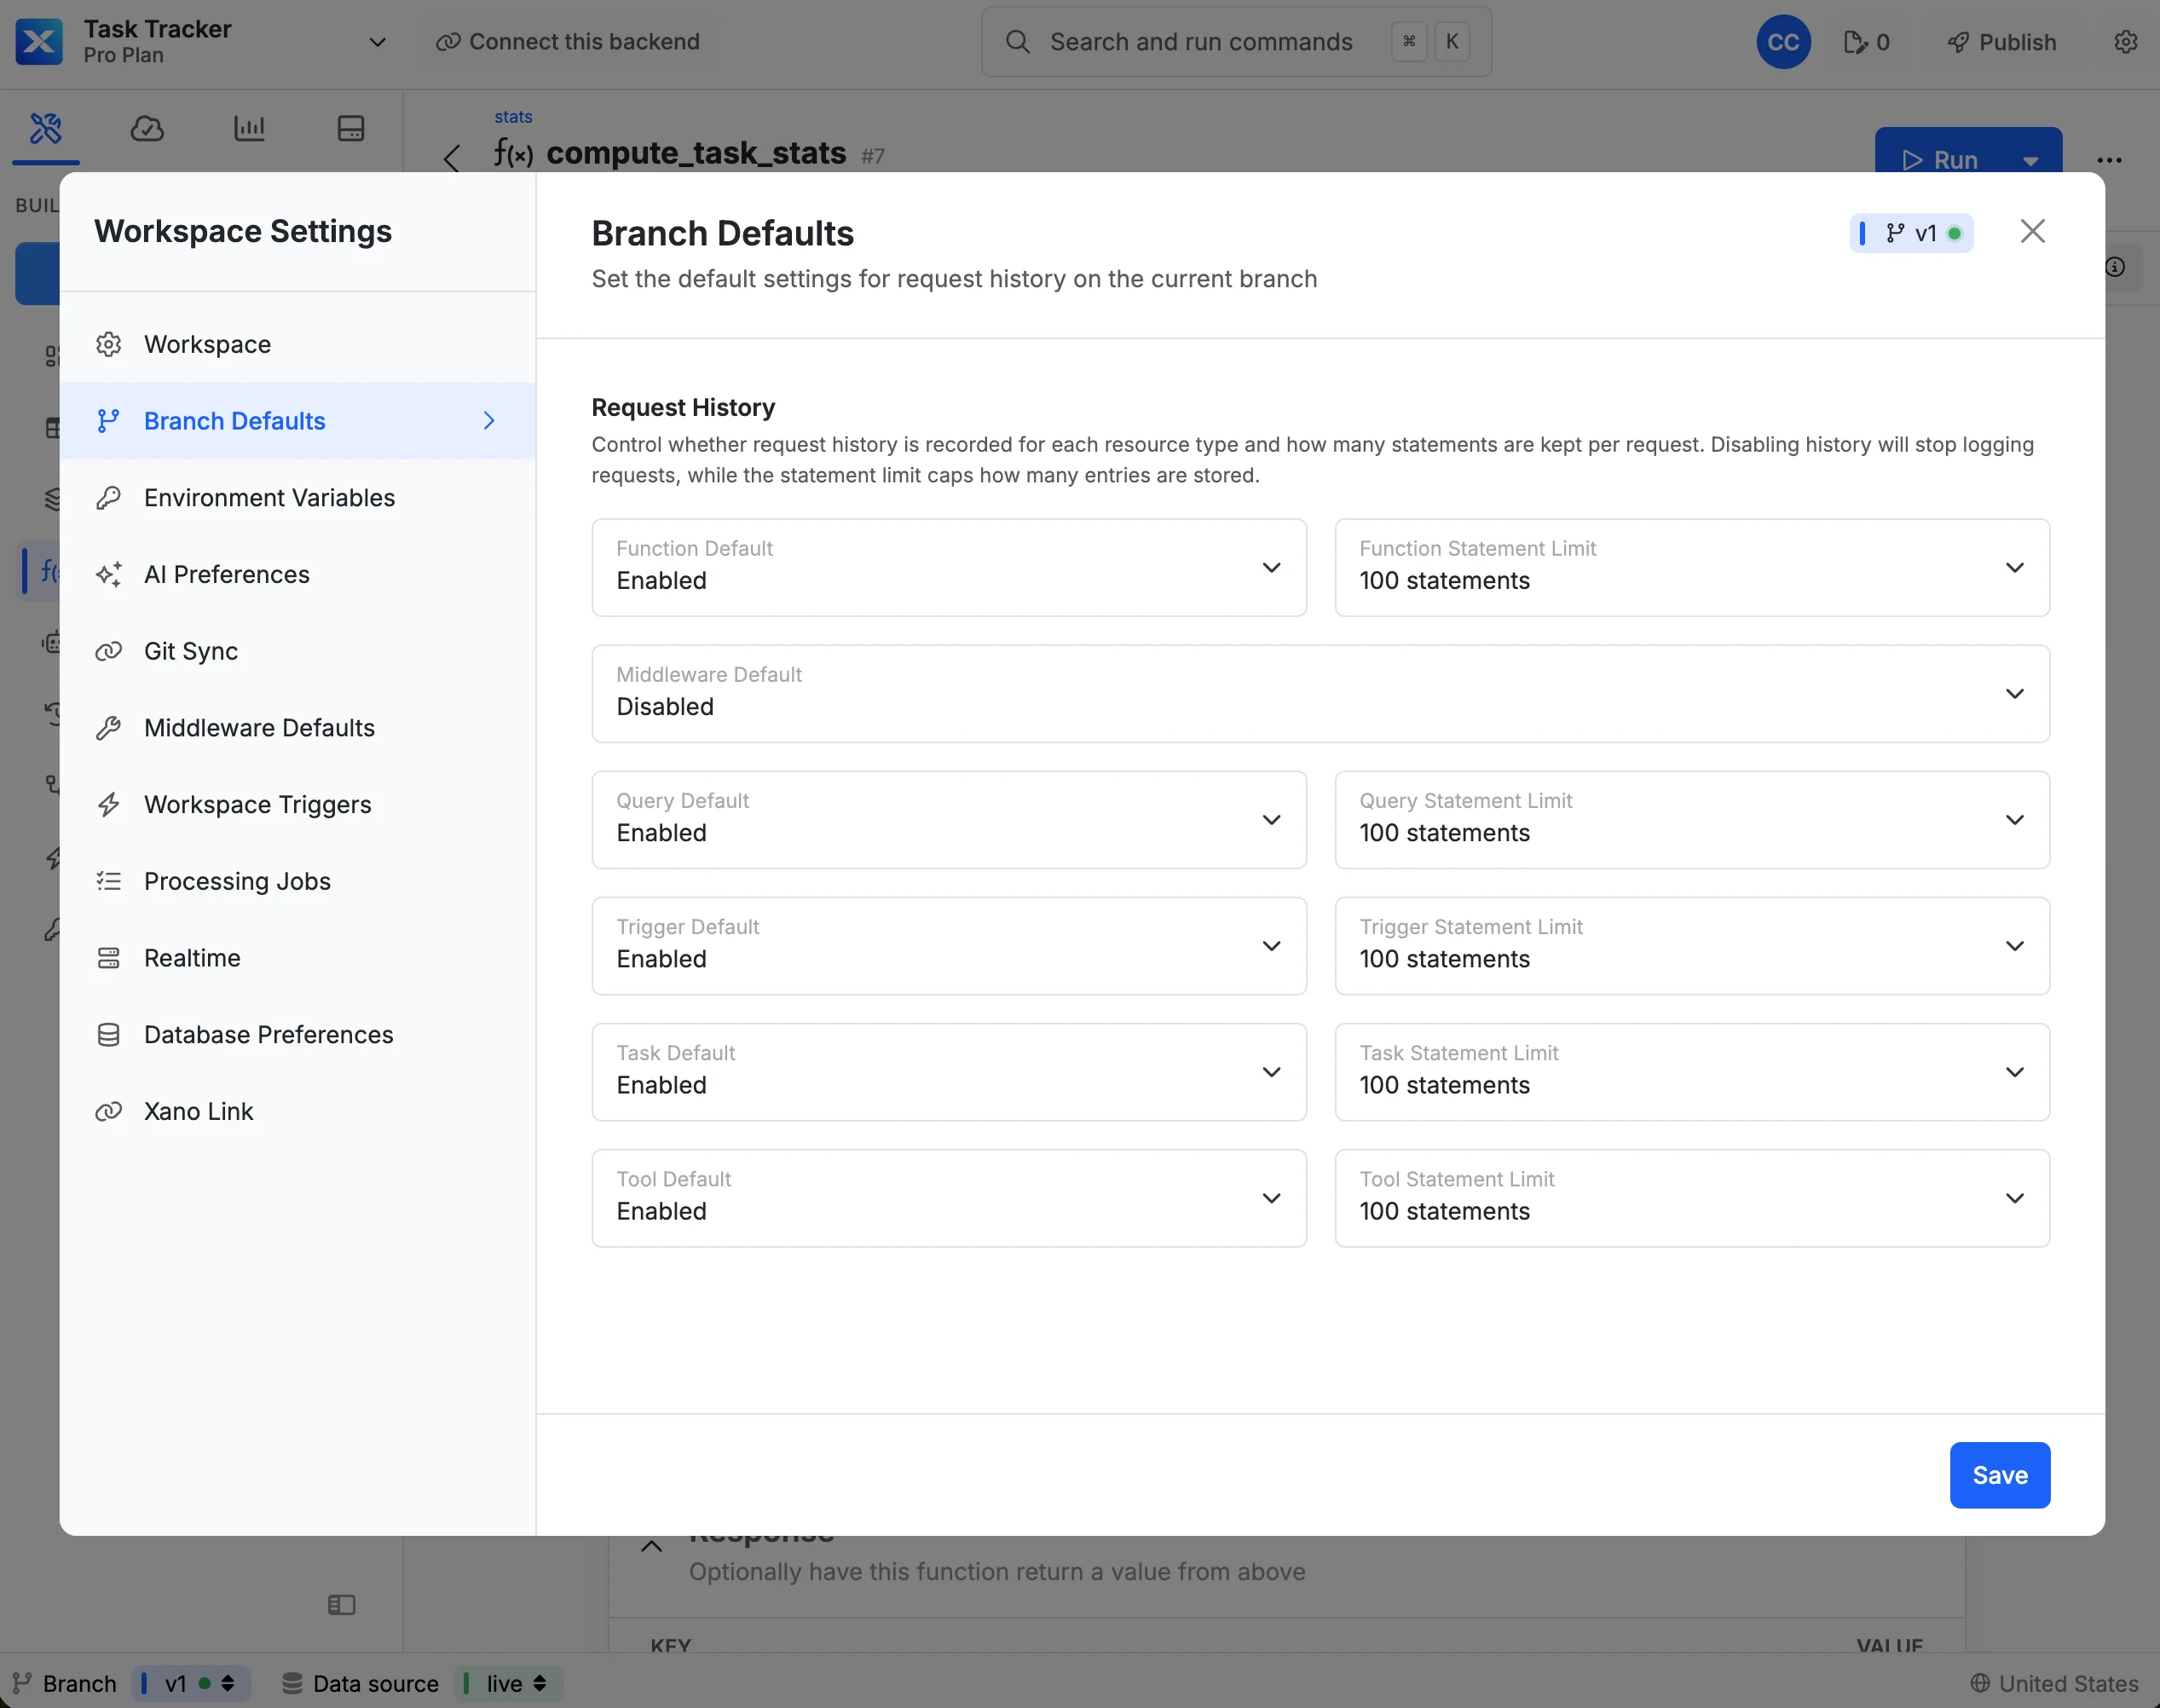 You can set both values for each resource type that maintains history — **APIs (queries), functions, tasks, middleware, triggers, and tools**:
* **Default** — **Enabled** or **Disabled**.
* **Statement limit** — how many function‑stack statements to capture per request:
* No statements
* 10 statements
* 100 statements
* 1,000 statements
* 10,000 statements
* Store all statements
Request history uses your database (SSD) storage. The more statements you store per type — and the more types you log — the more storage request history consumes. Consider lowering the statement limit, or disabling history for high‑volume types, to keep storage in check.
#### Per‑object settings (inherit or override)
Each individual API, function, task, middleware, trigger, or tool can control its own request history from its settings panel. By default these are set to **Inherit Settings**, so they follow the branch defaults — or set them to **Enabled** / **Disabled** to override for that object specifically (tasks offer **Enabled** or **Inherit Settings**). When history is disabled for an object, its request‑history view shows a notice pointing you to the settings panel where you can re‑enable it.
## Clearing request history
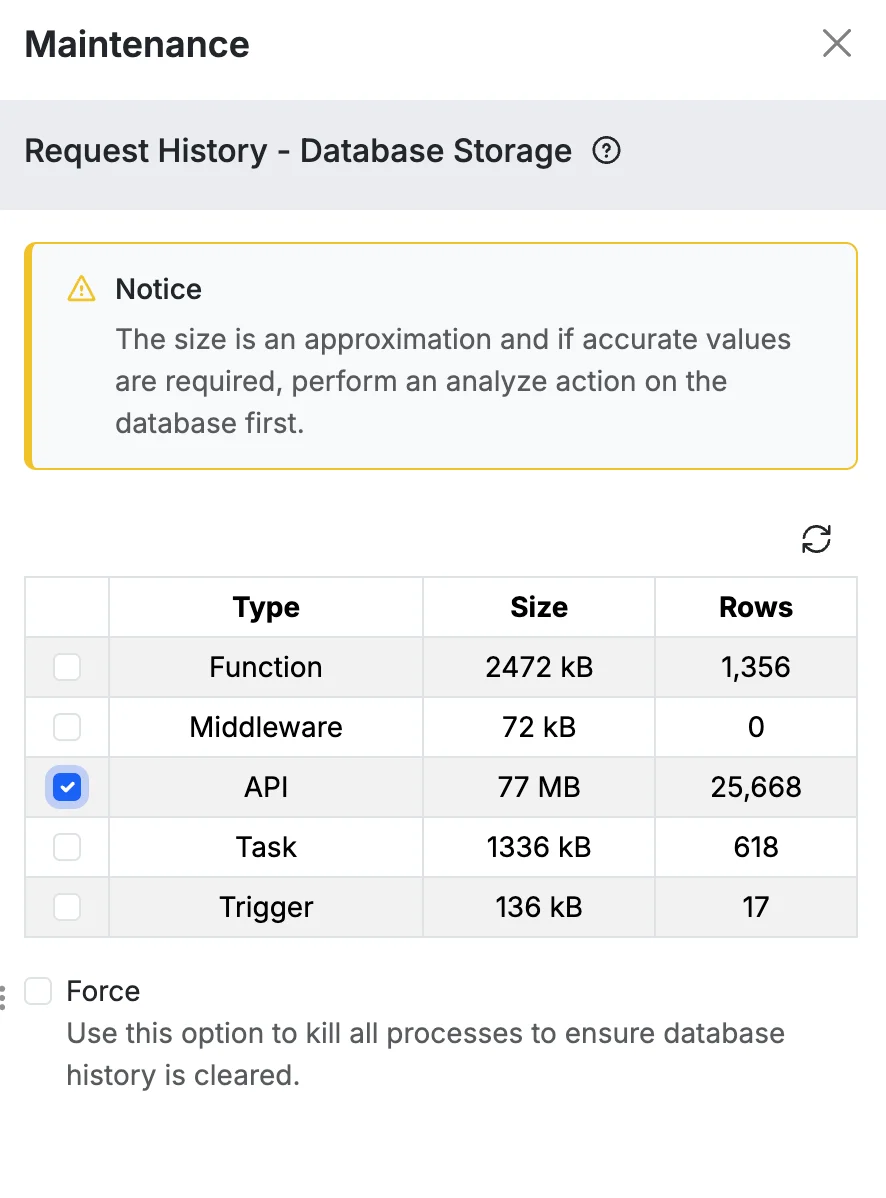
From your **Instance settings** you can manually clear request history at any time. This can be useful to free up used disk space or to troubleshoot instances that are under extreme load and having trouble recovering. To access these options, head to your instance settings and select **Maintenance** under Request History.
### Database storage
This is the database table that holds your request history and counts against your instance's database storage. You can clear a portion or all of it. Use the **Force** option to halt running processes so the data can be cleared — note this may cause brief downtime while the server stops those processes.
You can set both values for each resource type that maintains history — **APIs (queries), functions, tasks, middleware, triggers, and tools**:
* **Default** — **Enabled** or **Disabled**.
* **Statement limit** — how many function‑stack statements to capture per request:
* No statements
* 10 statements
* 100 statements
* 1,000 statements
* 10,000 statements
* Store all statements
Request history uses your database (SSD) storage. The more statements you store per type — and the more types you log — the more storage request history consumes. Consider lowering the statement limit, or disabling history for high‑volume types, to keep storage in check.
#### Per‑object settings (inherit or override)
Each individual API, function, task, middleware, trigger, or tool can control its own request history from its settings panel. By default these are set to **Inherit Settings**, so they follow the branch defaults — or set them to **Enabled** / **Disabled** to override for that object specifically (tasks offer **Enabled** or **Inherit Settings**). When history is disabled for an object, its request‑history view shows a notice pointing you to the settings panel where you can re‑enable it.
## Clearing request history
From your **Instance settings** you can manually clear request history at any time. This can be useful to free up used disk space or to troubleshoot instances that are under extreme load and having trouble recovering. To access these options, head to your instance settings and select **Maintenance** under Request History.
### Database storage
This is the database table that holds your request history and counts against your instance's database storage. You can clear a portion or all of it. Use the **Force** option to halt running processes so the data can be cleared — note this may cause brief downtime while the server stops those processes.
 **When should I use the 'force' option?**
This option is helpful if you are not just trying to clear the request history, but also trying to halt any currently ongoing writes to the database at the same time.
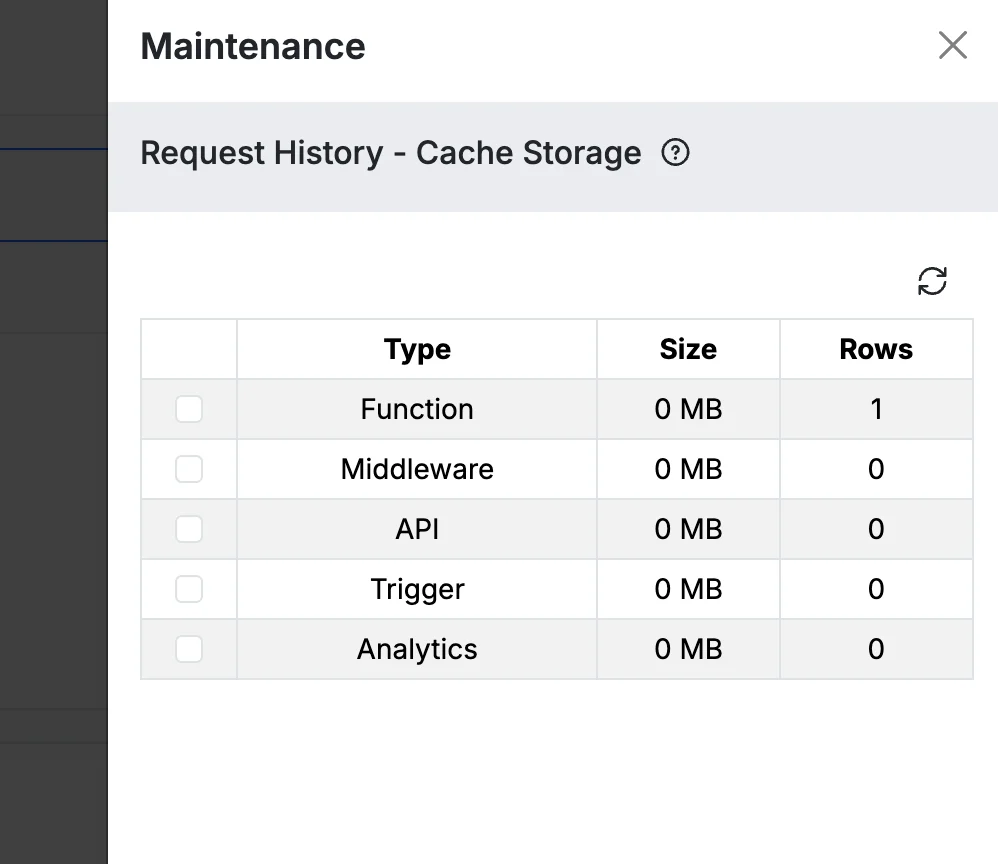
### Cache storage
Requests aren't written to the database immediately — they're held in a cache and flushed to the database at fast, regular intervals. During heavy traffic, clearing the request cache before items are flushed can help the instance recover. Items cleared from the cache are **not** written to the history database.
**When should I use the 'force' option?**
This option is helpful if you are not just trying to clear the request history, but also trying to halt any currently ongoing writes to the database at the same time.
### Cache storage
Requests aren't written to the database immediately — they're held in a cache and flushed to the database at fast, regular intervals. During heavy traffic, clearing the request cache before items are flushed can help the instance recover. Items cleared from the cache are **not** written to the history database.
 ## Accessing request history via API
You can retrieve and search request history programmatically through the [Metadata API](/api-reference/request-history/search-function-request-history). Each log type has a "retrieve" (list) and a "search" (advanced filter + sort) endpoint, for example:
* `GET workspace/{workspace_id}/request_history` and `POST workspace/{workspace_id}/request_history/search`
* The same pattern for `function_history`, `task_history`, `middleware_history`, `trigger_history`, and `tool_history`.
Pass `include_output=true` to include full request/response payloads (this can produce large responses). These endpoints are also exposed as MCP tools (e.g. `getApiRequestHistory`, `searchApiRequestHistory`) for AI clients.
## Error logs
Failed requests with uncaught errors are also surfaced in [Error Logs](/maintenance-monitoring-and-logging/error-logs). Use Request History to inspect a specific request end‑to‑end, and Error Logs to triage failures across your workspace.
## Related topics
- [RBAC (Role-based Access Control)](/enterprise/enterprise-features/rbac-role-based-access-control.md)
- [Maintenance](/the-database/database-performance-and-maintenance/maintenance.md)
- [Retrieve API request history](/api-reference/request-history/retrieve-api-request-history.md)
## Accessing request history via API
You can retrieve and search request history programmatically through the [Metadata API](/api-reference/request-history/search-function-request-history). Each log type has a "retrieve" (list) and a "search" (advanced filter + sort) endpoint, for example:
* `GET workspace/{workspace_id}/request_history` and `POST workspace/{workspace_id}/request_history/search`
* The same pattern for `function_history`, `task_history`, `middleware_history`, `trigger_history`, and `tool_history`.
Pass `include_output=true` to include full request/response payloads (this can produce large responses). These endpoints are also exposed as MCP tools (e.g. `getApiRequestHistory`, `searchApiRequestHistory`) for AI clients.
## Error logs
Failed requests with uncaught errors are also surfaced in [Error Logs](/maintenance-monitoring-and-logging/error-logs). Use Request History to inspect a specific request end‑to‑end, and Error Logs to triage failures across your workspace.
## Related topics
- [RBAC (Role-based Access Control)](/enterprise/enterprise-features/rbac-role-based-access-control.md)
- [Maintenance](/the-database/database-performance-and-maintenance/maintenance.md)
- [Retrieve API request history](/api-reference/request-history/retrieve-api-request-history.md)